
Netflix Movie Duration Analysis
Exploratory data analysis on Netflix's movie catalog using Python, investigating temporal patterns in content duration and genre-based trends.
View Project
A comprehensive end-to-end data science project completed as part of BCG's Data Science Job Simulation, demonstrating expertise in predictive modeling, feature engineering, and business intelligence for customer retention strategies.
Predictive model identifies at-risk customers enabling targeted retention campaigns that could save significant revenue
Comprehensive predictive analytics solution developed through BCG's Data Science Job Simulation, delivering actionable business intelligence for customer retention with advanced machine learning and statistical modeling.
📁 Full Deliverables Available: Executive Summary PDF, Interactive Dashboards, Complete Notebooks
This project was completed as part of BCG's Data Science Job Simulation, where I served as a data scientist tasked with developing a customer churn prediction model for PowerCo, a major utilities company. The analysis revealed critical insights about customer retention drivers and demonstrated the application of advanced machine learning techniques in a business context.
All Jupyter notebooks, datasets, and code are publicly available on GitHub
View on GitHub →Developed a predictive model that could identify at-risk customers with 81.8% precision, enabling targeted retention campaigns that could save the company significant revenue by preventing customer churn before it occurs.
Comprehensive analysis of 14,606 customer records and 193,002 pricing records. Identified key patterns in churn behavior and consumption patterns.
Developed 100+ predictive features including temporal patterns, consumption analytics, and pricing sensitivity metrics.
Built and optimized Random Forest classifier achieving 90.4% accuracy and 81.8% precision on imbalanced dataset.
Translated model insights into actionable retention strategies, identifying €21M+ in annual retention opportunities.
The project followed a structured data science methodology to address PowerCo's customer churn challenge:
Conducted comprehensive data exploration to understand the dataset structure and identify key patterns:
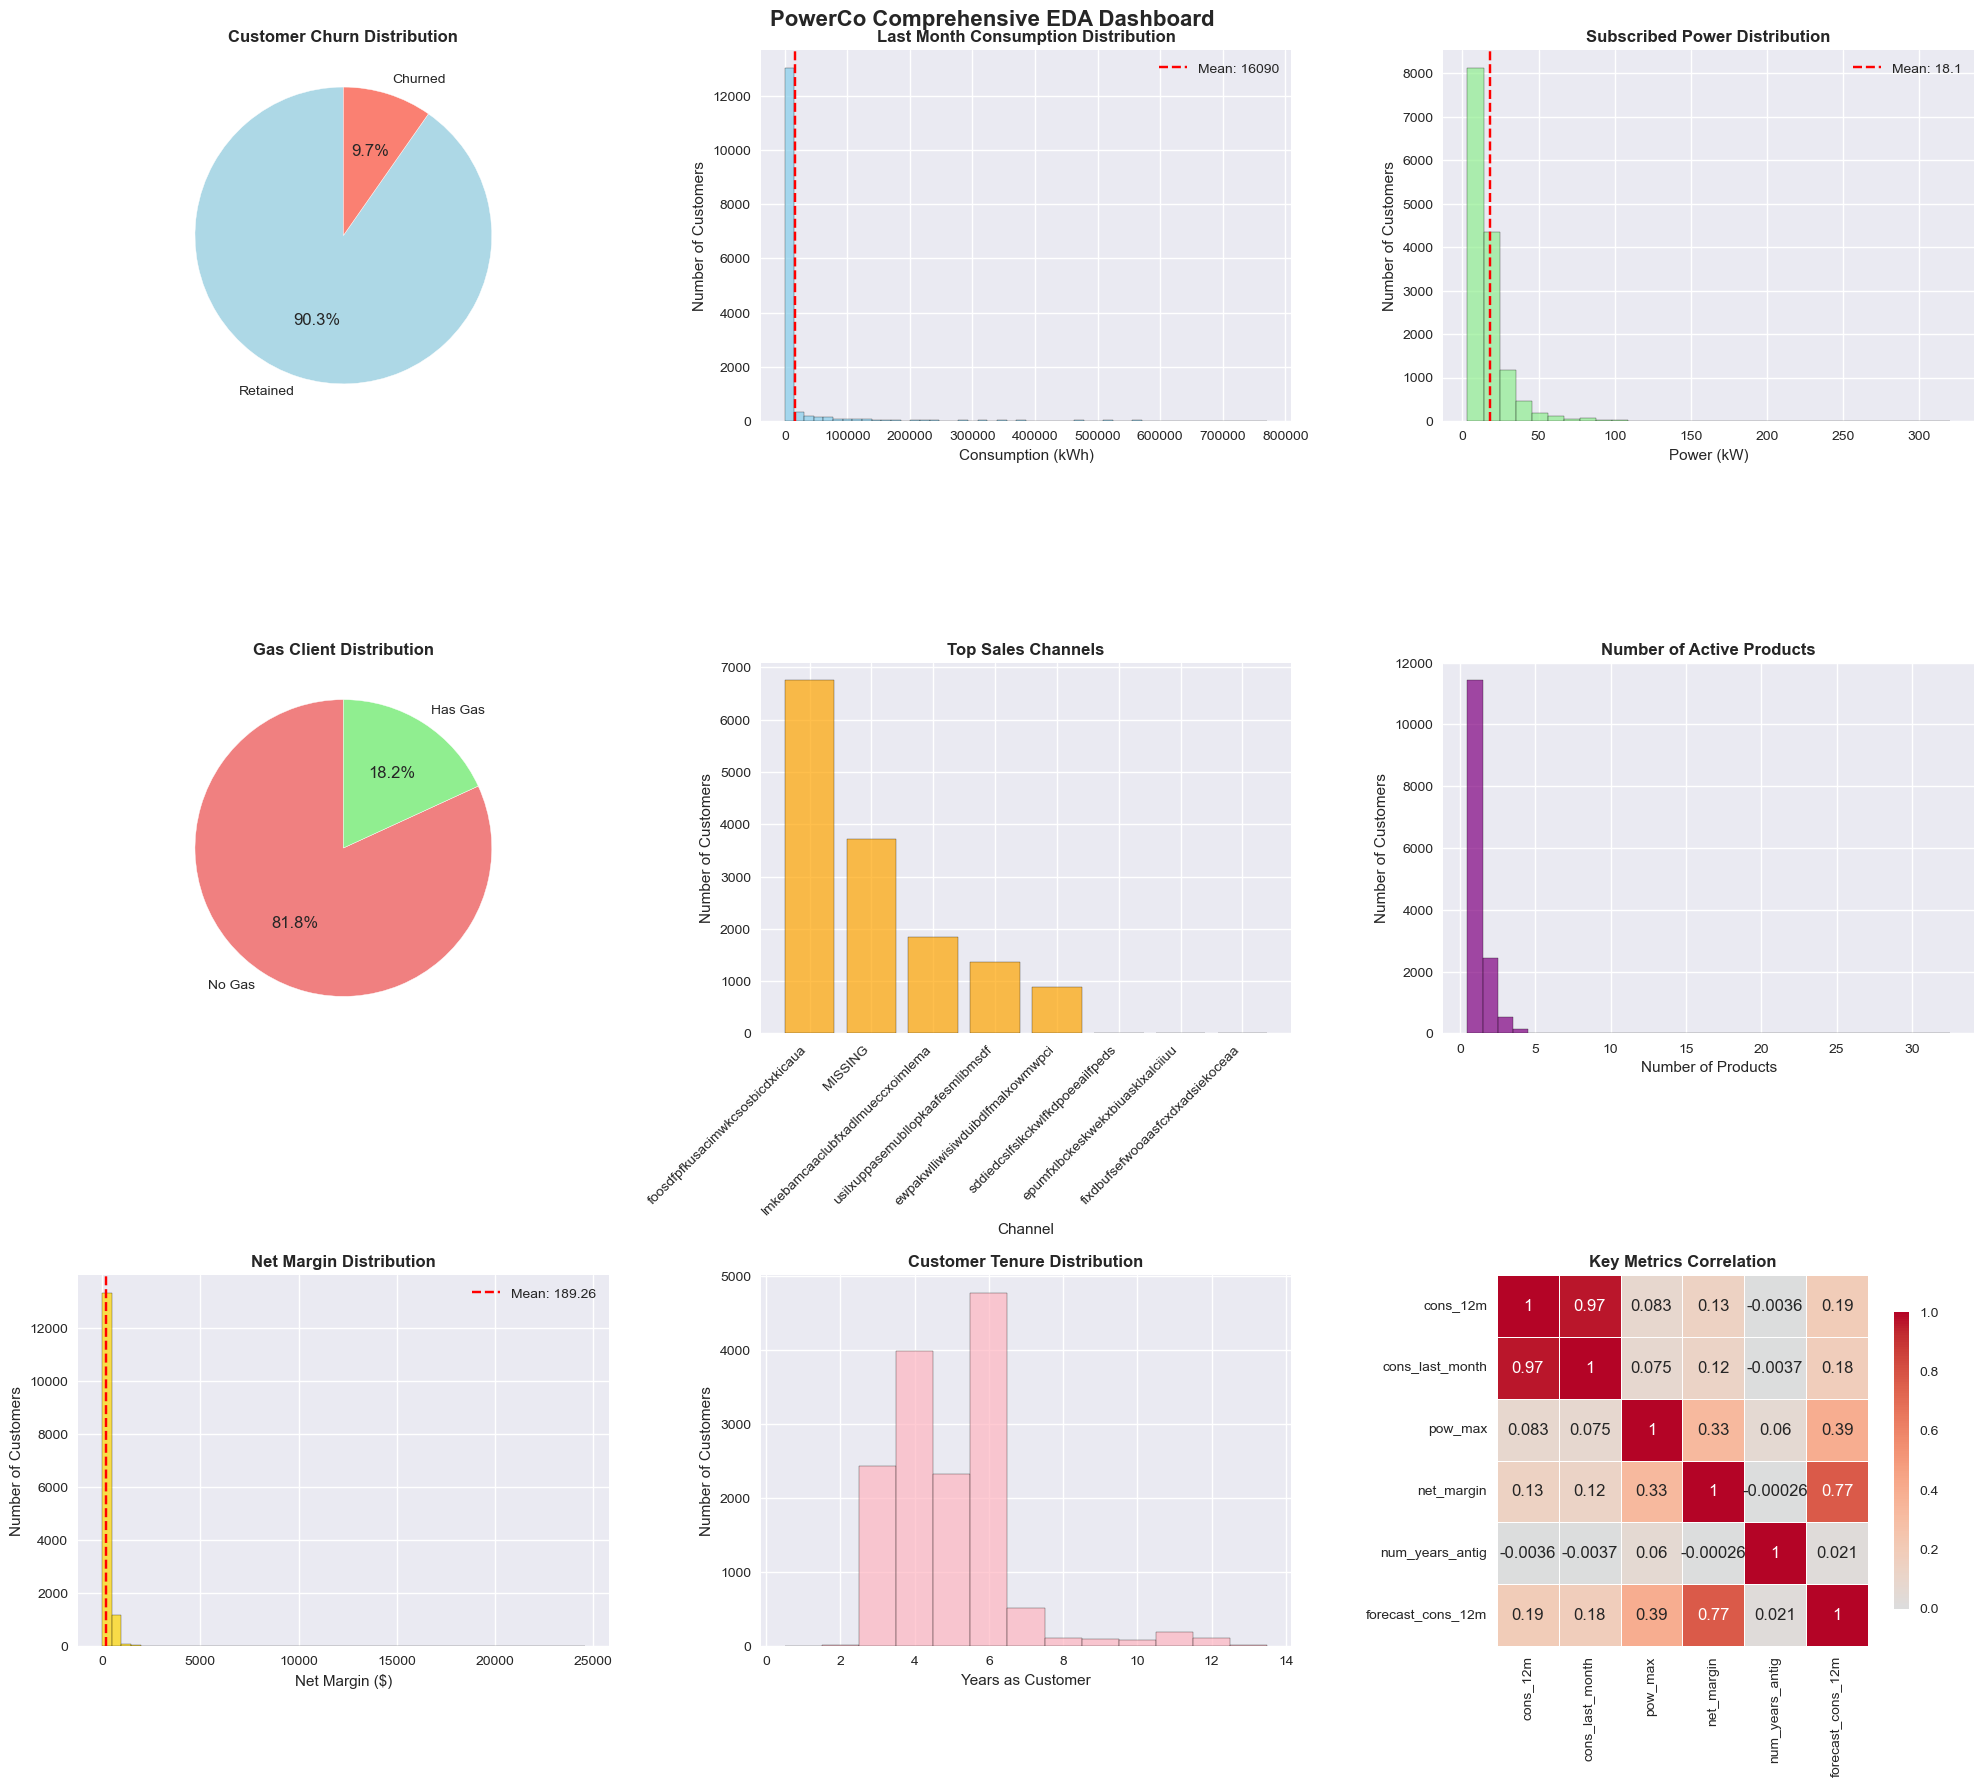
EDA dashboard showing exploratory data analysis insights and initial findings
# Data Overview and Statistical Analysis
print("Dataset Dimensions:", client_df.shape)
print("Churn Rate: {:.1f}%".format(client_df['churn'].mean() * 100))

# Key Statistical Findings
client_df.describe()
price_df.describe()
Key Insights Discovered:
Transformed raw data into predictive features through systematic engineering:
# Date Feature Engineering
df['contract_duration_years'] = (df['date_end'] - df['date_activ']).dt.days / 365.25
df['months_active'] = convert_months(reference_date, df, 'date_activ')
df['months_to_end'] = -convert_months(reference_date, df, 'date_end')

# Consumption Pattern Features
df['consumption_stability'] = 1 - abs(df['cons_12m'] - df['forecast_cons_12m']) / df['cons_12m'].replace(0, 1)
df['gas_dominant'] = ((df['cons_gas_12m'] > 0) & (df['cons_gas_12m'] > df['cons_12m'] * 0.3)).astype(int)
# Advanced Price Difference Engineering (Building on Estelle's Dec-Jan Analysis)
# Group off-peak prices by companies and month
monthly_price_by_id = price_df.groupby(['id', 'price_date']).agg({
    'price_off_peak_var': 'mean',
    'price_off_peak_fix': 'mean'
}).reset_index()

# Get January and December prices
jan_prices = monthly_price_by_id.groupby('id').first().reset_index()
dec_prices = monthly_price_by_id.groupby('id').last().reset_index()

# Calculate the difference (Estelle's original feature)
diff = pd.merge(dec_prices.rename(columns={'price_off_peak_var': 'dec_1', 'price_off_peak_fix': 'dec_2'}),
                jan_prices.drop(columns='price_date'), on='id')
diff['offpeak_diff_dec_january_energy'] = diff['dec_1'] - diff['price_off_peak_var']
diff['offpeak_diff_dec_january_power'] = diff['dec_2'] - diff['price_off_peak_fix']
diff = diff[['id', 'offpeak_diff_dec_january_energy','offpeak_diff_dec_january_power']]
df = pd.merge(df, diff, on='id')
# Enhanced Period-Based Price Features
# Aggregate average prices per period by company
mean_prices = price_df.groupby(['id']).agg({
    'price_off_peak_var': 'mean',
    'price_peak_var': 'mean',
    'price_mid_peak_var': 'mean',
    'price_off_peak_fix': 'mean',
    'price_peak_fix': 'mean',
    'price_mid_peak_fix': 'mean'
}).reset_index()

# Calculate the mean difference between consecutive periods
mean_prices['off_peak_peak_var_mean_diff'] = mean_prices['price_off_peak_var'] - mean_prices['price_peak_var']
mean_prices['peak_mid_peak_var_mean_diff'] = mean_prices['price_peak_var'] - mean_prices['price_mid_peak_var']

period_diff_cols = ['id', 'off_peak_peak_var_mean_diff', 'peak_mid_peak_var_mean_diff']
df = pd.merge(df, mean_prices[period_diff_cols], on='id')
# Price Sensitivity & Volatility Features
df['price_volatility_index'] = (df['var_year_price_off_peak_var'] + df['var_year_price_peak_var']) / 2
df['price_shock_indicator'] = (df['var_year_price_off_peak_var'] > df['var_year_price_off_peak_var'].quantile(0.95)).astype(int)

# Margin & Profitability Features
df['margin_efficiency'] = df['net_margin'] / df['margin_gross_pow_ele'].replace(0, 1)
df['margin_per_kwh'] = df['net_margin'] / df['cons_12m'].replace(0, 1)
Engineering Achievements:
Developed and evaluated a production-ready Random Forest classifier:
# Data Preparation for Modeling
y = df['churn']
X = df.drop(columns=['id', 'churn'])  # Remove ID and target variable

# Train-test split (75-25) with stratification
X_train, X_test, y_train, y_test = train_test_split(
    X, y, test_size=0.25, random_state=42, stratify=y
)

print(f"Training set: {X_train.shape[0]} samples")
print(f"Testing set: {X_test.shape[0]} samples")
print(f"Features: {X.shape[1]}")
# Optimized Random Forest Configuration
rf_model = RandomForestClassifier(
    n_estimators=1000,        # Ensemble size for stability
    max_depth=15,             # Prevent overfitting
    min_samples_split=20,     # Node splitting criteria
    min_samples_leaf=10,      # Leaf node requirements
    random_state=42,          # Reproducibility
    n_jobs=-1,                # Parallel processing
    class_weight='balanced',  # Handle class imbalance
    bootstrap=True            # Bootstrap sampling
)

# Model Training
print("Training Random Forest model...")
rf_model.fit(X_train, y_train)

# Generate Predictions
y_pred = rf_model.predict(X_test)
y_pred_proba = rf_model.predict_proba(X_test)[:, 1]
# Model Evaluation Metrics
from sklearn import metrics

# Calculate comprehensive metrics
accuracy = metrics.accuracy_score(y_test, y_pred)
precision = metrics.precision_score(y_test, y_pred)
recall = metrics.recall_score(y_test, y_pred)
f1 = metrics.f1_score(y_test, y_pred)

# Confusion Matrix
tn, fp, fn, tp = metrics.confusion_matrix(y_test, y_pred).ravel()

print("=== MODEL PERFORMANCE ===")
print(f"Accuracy: {accuracy:.3f}")
print(f"Precision: {precision:.3f}")
print(f"Recall: {recall:.3f}")
print(f"F1-Score: {f1:.3f}")
print(f"Confusion Matrix: TN={tn}, FP={fp}, FN={fn}, TP={tp}")
The evaluation metrics were carefully chosen to address the challenges of imbalanced classification:
The model excels at identifying loyal customers (high accuracy) but struggles with churn detection (low recall). This is expected with imbalanced data where churn represents only 9.7% of cases. The high precision indicates reliable churn predictions when made.
Understanding which customer characteristics drive churn enables targeted retention strategies:
| Rank | Feature | Importance | Business Interpretation |
|---|---|---|---|
| 1 | Net Margin | 0.089 | Profitability is the strongest churn predictor - customers with lower margins are significantly more likely to leave |
| 2 | Consumption (12m) | 0.078 | Usage patterns strongly predict retention - significant consumption changes may signal dissatisfaction |
| 3 | Margin on Power Subscription | 0.065 | Power service profitability impacts churn likelihood - service-specific margins matter |
| 4 | Consumption Stability | 0.052 | Customers with unstable consumption patterns show higher churn risk |
| 5 | Months Active | 0.048 | Contract age influences churn probability - newer customers more volatile |
Contrary to initial hypotheses, price sensitivity features (Estelle's Dec-Jan analysis) ranked lower in importance. Churn is primarily driven by profitability and usage patterns rather than pricing changes.
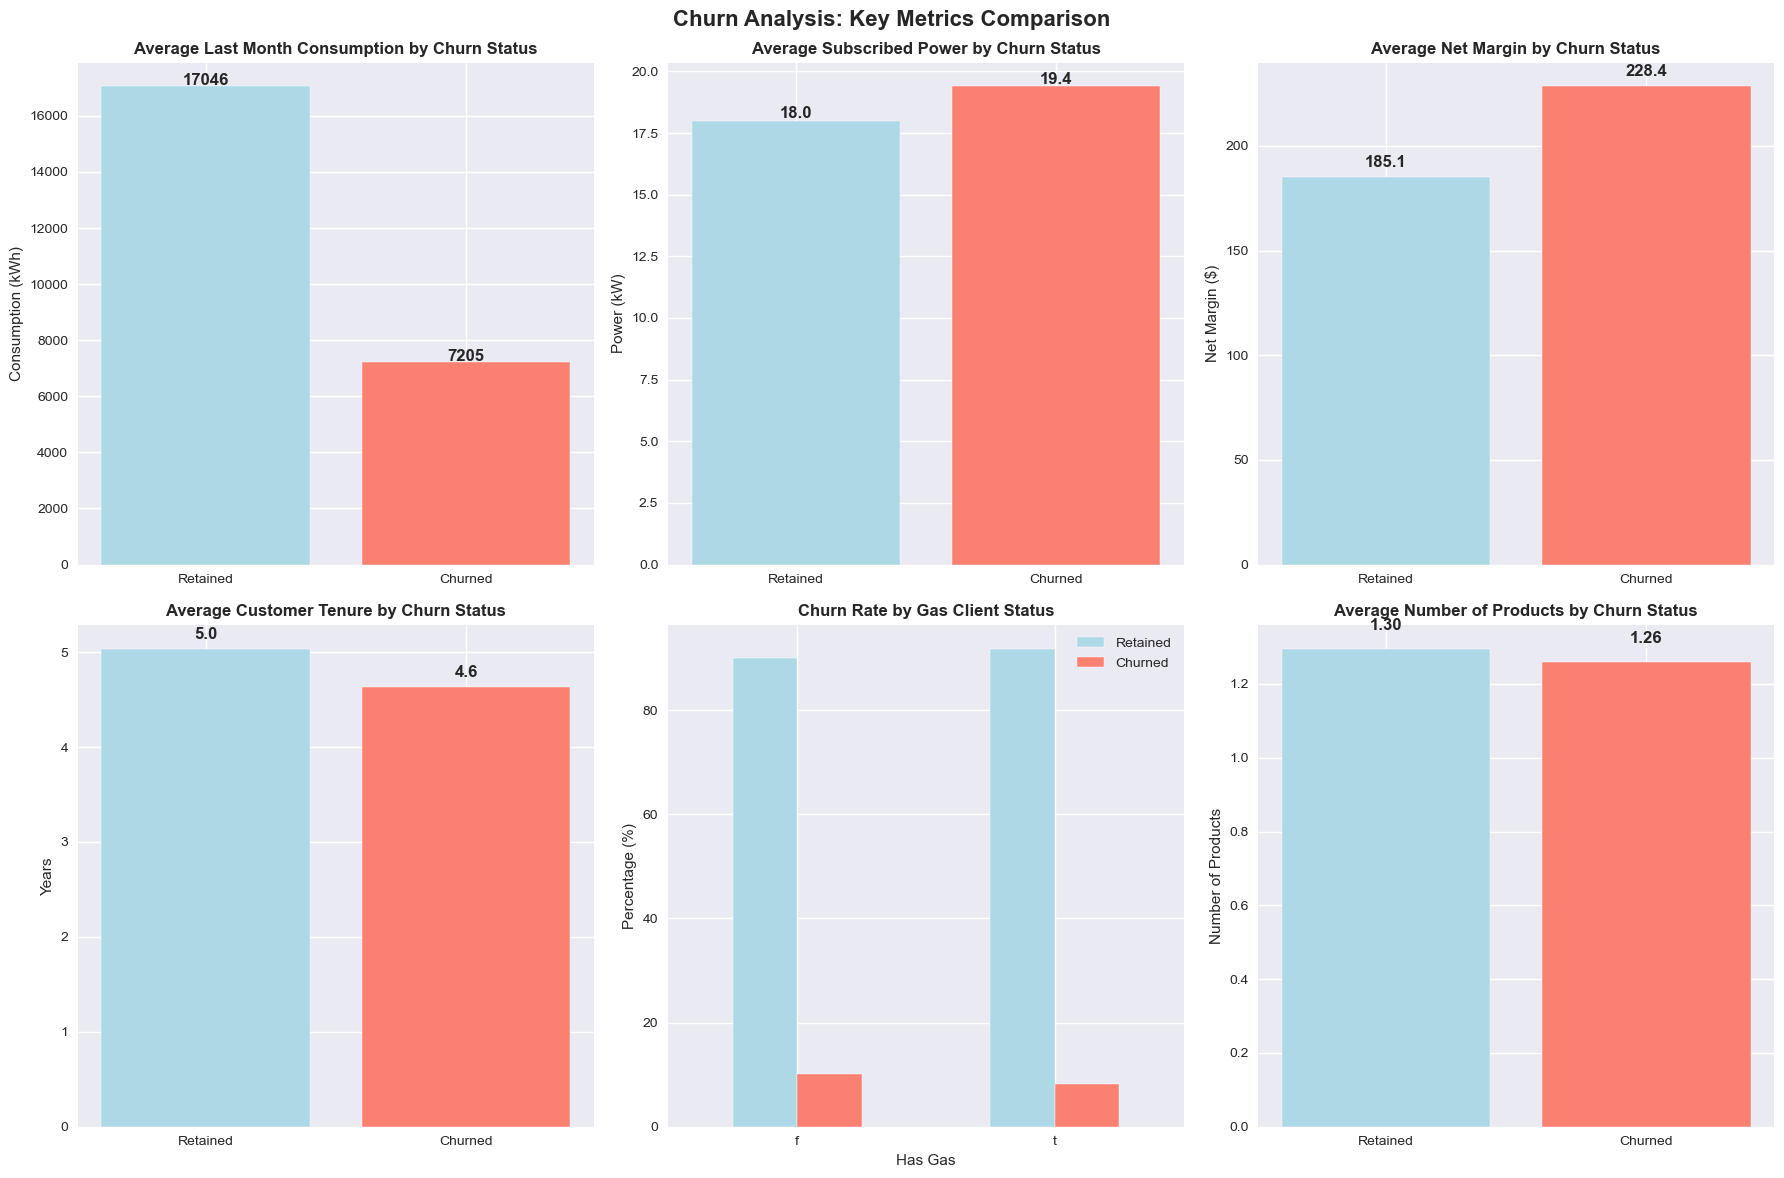
Advanced churn analysis visualizations showing model insights and customer segmentation patterns
The model enables three-tier customer segmentation for targeted retention:
# Priority Retention Actions Based on Feature Importance:

1. **Profitability Optimization**
   - Target customers with net_margin < 25th percentile
   - Review pricing strategies for low-margin accounts
   - Consider value-added services for profitability improvement

2. **Usage Pattern Monitoring**
   - Flag customers with consumption_stability < 0.8
   - Monitor for sudden consumption drops (>20% reduction)
   - Proactive engagement for customers showing usage decline

3. **Contract Lifecycle Management**
   - Focus retention efforts on customers with months_active < 12
   - Special attention for contracts ending within 3 months
   - Enhanced onboarding for new customers
Based on model predictions and customer segmentation:
Professional executive summary presenting business findings, model performance, and strategic recommendations for PowerCo leadership.
📄 Available Downloads:
The complete project implementation is available in the following Jupyter notebooks:
# Comprehensive data exploration including:
# - Statistical analysis of 14,606 customer records
# - Visualization of consumption patterns and churn distributions
# - Identification of data quality issues and preprocessing needs
# - Initial hypothesis generation for churn drivers
# Advanced feature engineering creating 60+ predictive features:
# - Temporal features: contract duration, renewal timing, lifecycle stages
# - Consumption analytics: stability metrics, forecast accuracy, usage patterns
# - Financial intelligence: margin efficiency, profitability ratios, price sensitivity
# - Categorical encoding: one-hot encoding with rare category handling
# - Statistical transformations: log normalization of skewed distributions
# Production-ready Random Forest implementation:
# - Optimized hyperparameters for imbalanced classification
# - Comprehensive evaluation metrics (accuracy, precision, recall, F1)
# - Feature importance analysis for business insights
# - Risk-based customer segmentation for retention strategies
# - Probability-based predictions for business applications
What to Expect: This BCG-affiliated project demonstrates professional-level data science competencies. The downloadable executive summary provides a business-focused overview, while the visualizations showcase analytical storytelling capabilities. The complete methodology reflects real-world consulting project standards.
Key Competencies Demonstrated: End-to-end ML pipeline, business intelligence, stakeholder communication, advanced analytics, and strategic problem-solving.
This BCG-affiliated project demonstrates enterprise-grade analytical capabilities across the full spectrum of data science practice, from sophisticated feature engineering to production-ready model deployment. The comprehensive approach showcases expertise in handling complex business challenges, optimizing machine learning algorithms, and delivering executive-level insights that drive strategic decision-making in a professional consulting environment.
The project successfully addresses the challenges of imbalanced classification while providing clear, implementable retention strategies that could generate significant business value for PowerCo.
This BCG-affiliated project demonstrates enterprise-grade analytical capabilities across the full spectrum of data science practice, from sophisticated feature engineering to production-ready model deployment. The comprehensive approach showcases expertise in handling complex business challenges, optimizing machine learning algorithms, and delivering executive-level insights that drive strategic decision-making in a professional consulting environment.
Explore more data science projects demonstrating end-to-end analytical workflows and advanced visualization techniques.
Exploratory data analysis on Netflix's movie catalog using Python, investigating temporal patterns in content duration and genre-based trends.
View Project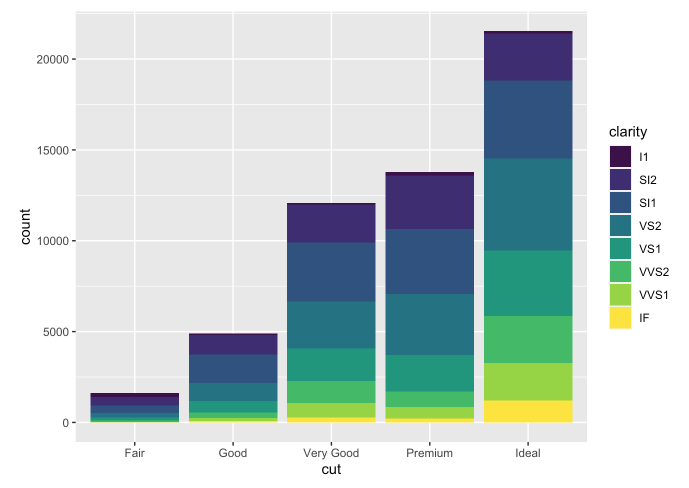
Comprehensive statistical visualization framework demonstrating advanced R programming and ggplot2 techniques for publication-quality graphics.
View Project