Python SAT Performance Analysis
Analyzing the performance of NYC public schools based on SAT scores to identify the top performing schools and understand the factors contributing to high performance.
SkillsView Project
I am a skilled and experienced data analyst with a passion for uncovering insights and trends within complex sets of data. I have a proven track record of success in a variety of industries, and I am well-versed in a wide range of tools and technologies that are essential for data analysis and visualization. I am experienced in programming languages such as Python and R, data storage and management, data cleaning and preprocessing, data exploration and statistics, machine learning, cloud computing, business intelligence, and data governance. I have a talent for finding insights in large and complex data sets, and I am able to present my findings in a clear and compelling way.
In the 'LEARN MORE' Tab, you can find my portfolio, which showcases a few of my projects, with the tools and methods used, and their results. You can also find my resume and contact information below.
Learn moreExplore my diverse portfolio of data analytics projects, where I have applied my skills to uncover insights and drive results. See the impact of my work through brief overviews, images, visualizations, and learn more about my abilities as a data analyst.
Analyzing the performance of NYC public schools based on SAT scores to identify the top performing schools and understand the factors contributing to high performance.
SkillsExploring the trends in movie durations on Netflix to determine if movies are getting shorter over time and identifying the contributing factors.
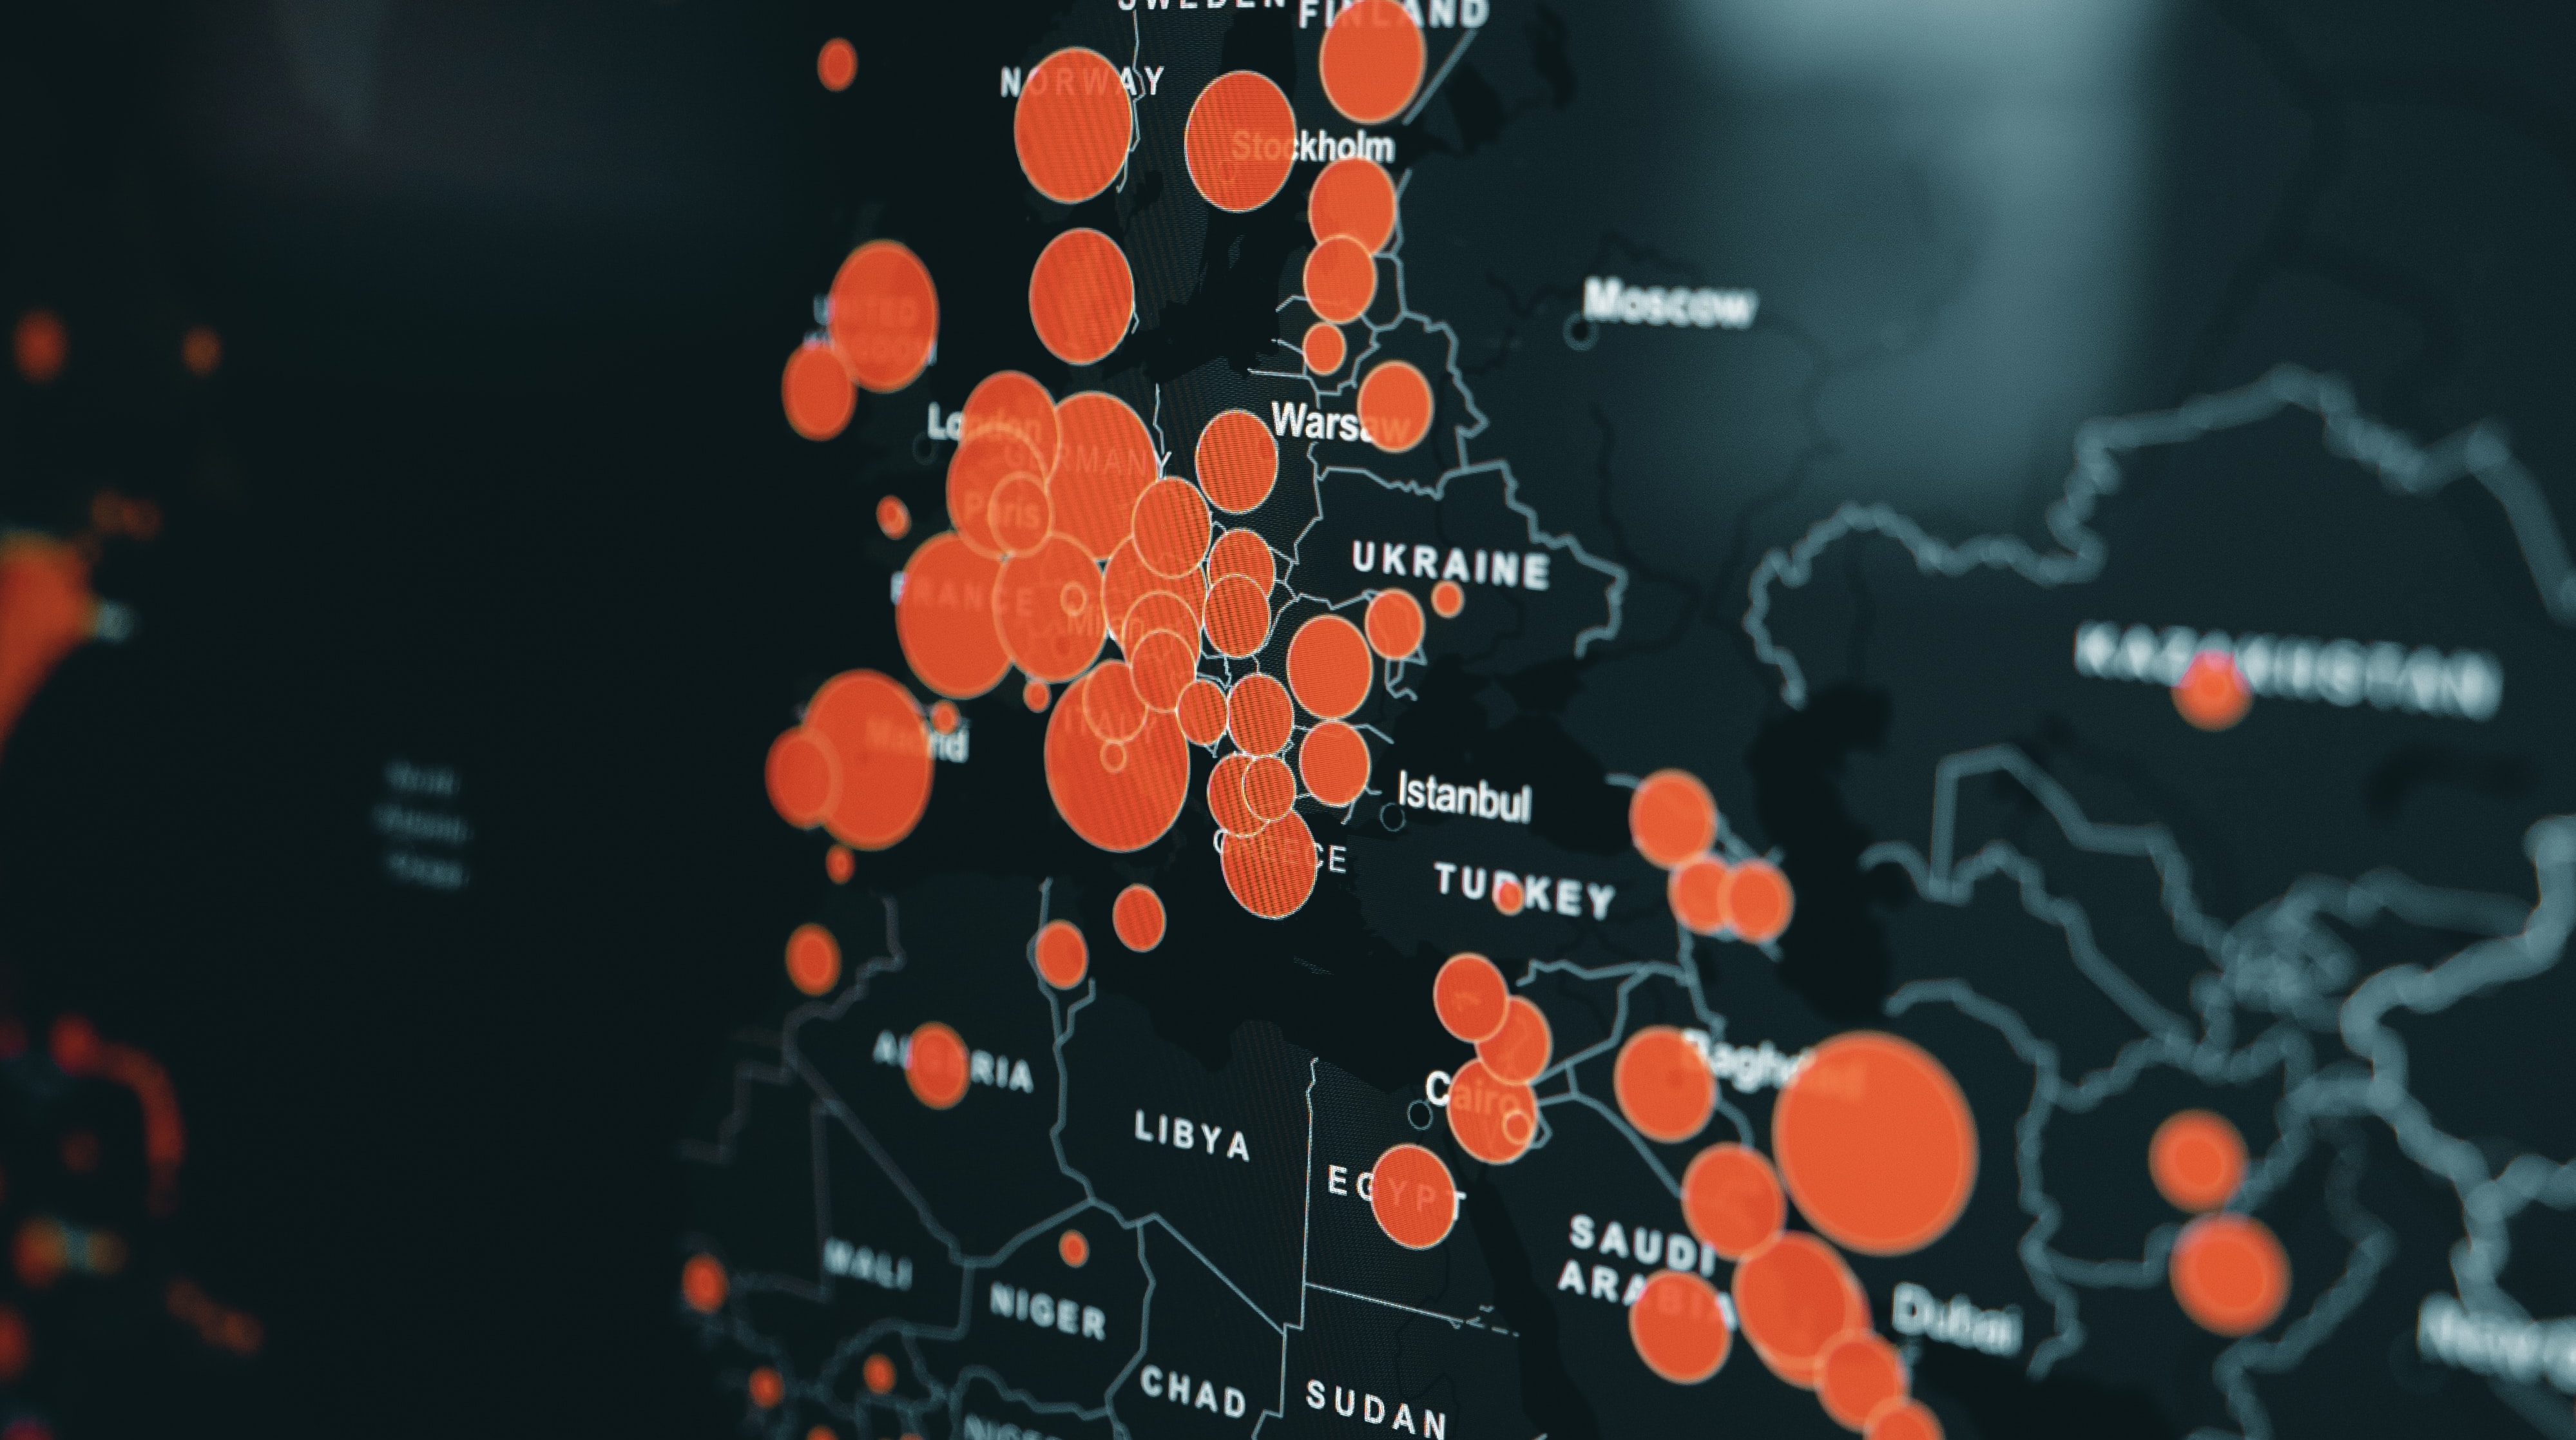
SkillsUncovering the impact of COVID-19 through data exploration, cleaning, and manipulation using SQL and seeing the results in the form of four informative tables.
SkillsDynamic and interactive Data Visualization dashboard created with Tableau that allows users to explore and analyze data related to the COVID-19 Pandemic.
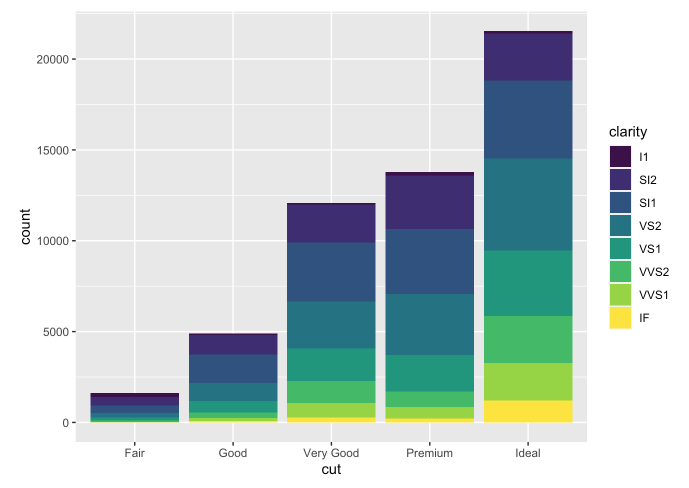
SkillsThe R and ggplot project is a data analysis and visualization project completed in the R programming language, utilizing the ggplot library. The project involves importing and cleaning data, performing statistical analyses, and creating attractive and informative visualizations to communicate the insights gained from the data.
Skills